
Admin Dashboard (Control Panel)
password-protected control panel for admin provides a convenient and secure way for administrators to manage and share streaming content
AS an Input using:- RTMP Push/Pull
- MultiProfile HLS
- SRT Push/Pull
- RTMP
- SRT
- Zixi
- SLDP
- HLS - By providing users with m3u8 links and HTML5 embed code for streams, which allow your users to easily access and in addition you can share the video content on different platforms and websites. This feature can help to increase the reach of the video content and promote the service among new audiences
- No hard limit on number of channels: the ability to offer an unlimited number of channels is a valuable feature, as with it we provide you with the flexibility and scalability you need to meet your unique streaming requirements.
- including high-quality statistics: is an important feature, as it can provide you with valuable insights into your streaming performance, as well as the tools you need to make data-driven decisions about your streaming business strategy
Analytics
Statistics and analytics play a critical role in understanding audience behavior and preferences, optimizing content offerings, and driving business growth. Data-driven insights are becoming increasingly valuable for making informed decisions that can increase customer retention, attract new subscribers, and improve revenue streams. By leveraging data and analytics tools, streaming content providers can gain a competitive edge, optimize performance, and provide a personalized and engaging viewing experience for users.
With Tulix, some of the analytics available for utilization include (click photos to enlarge):
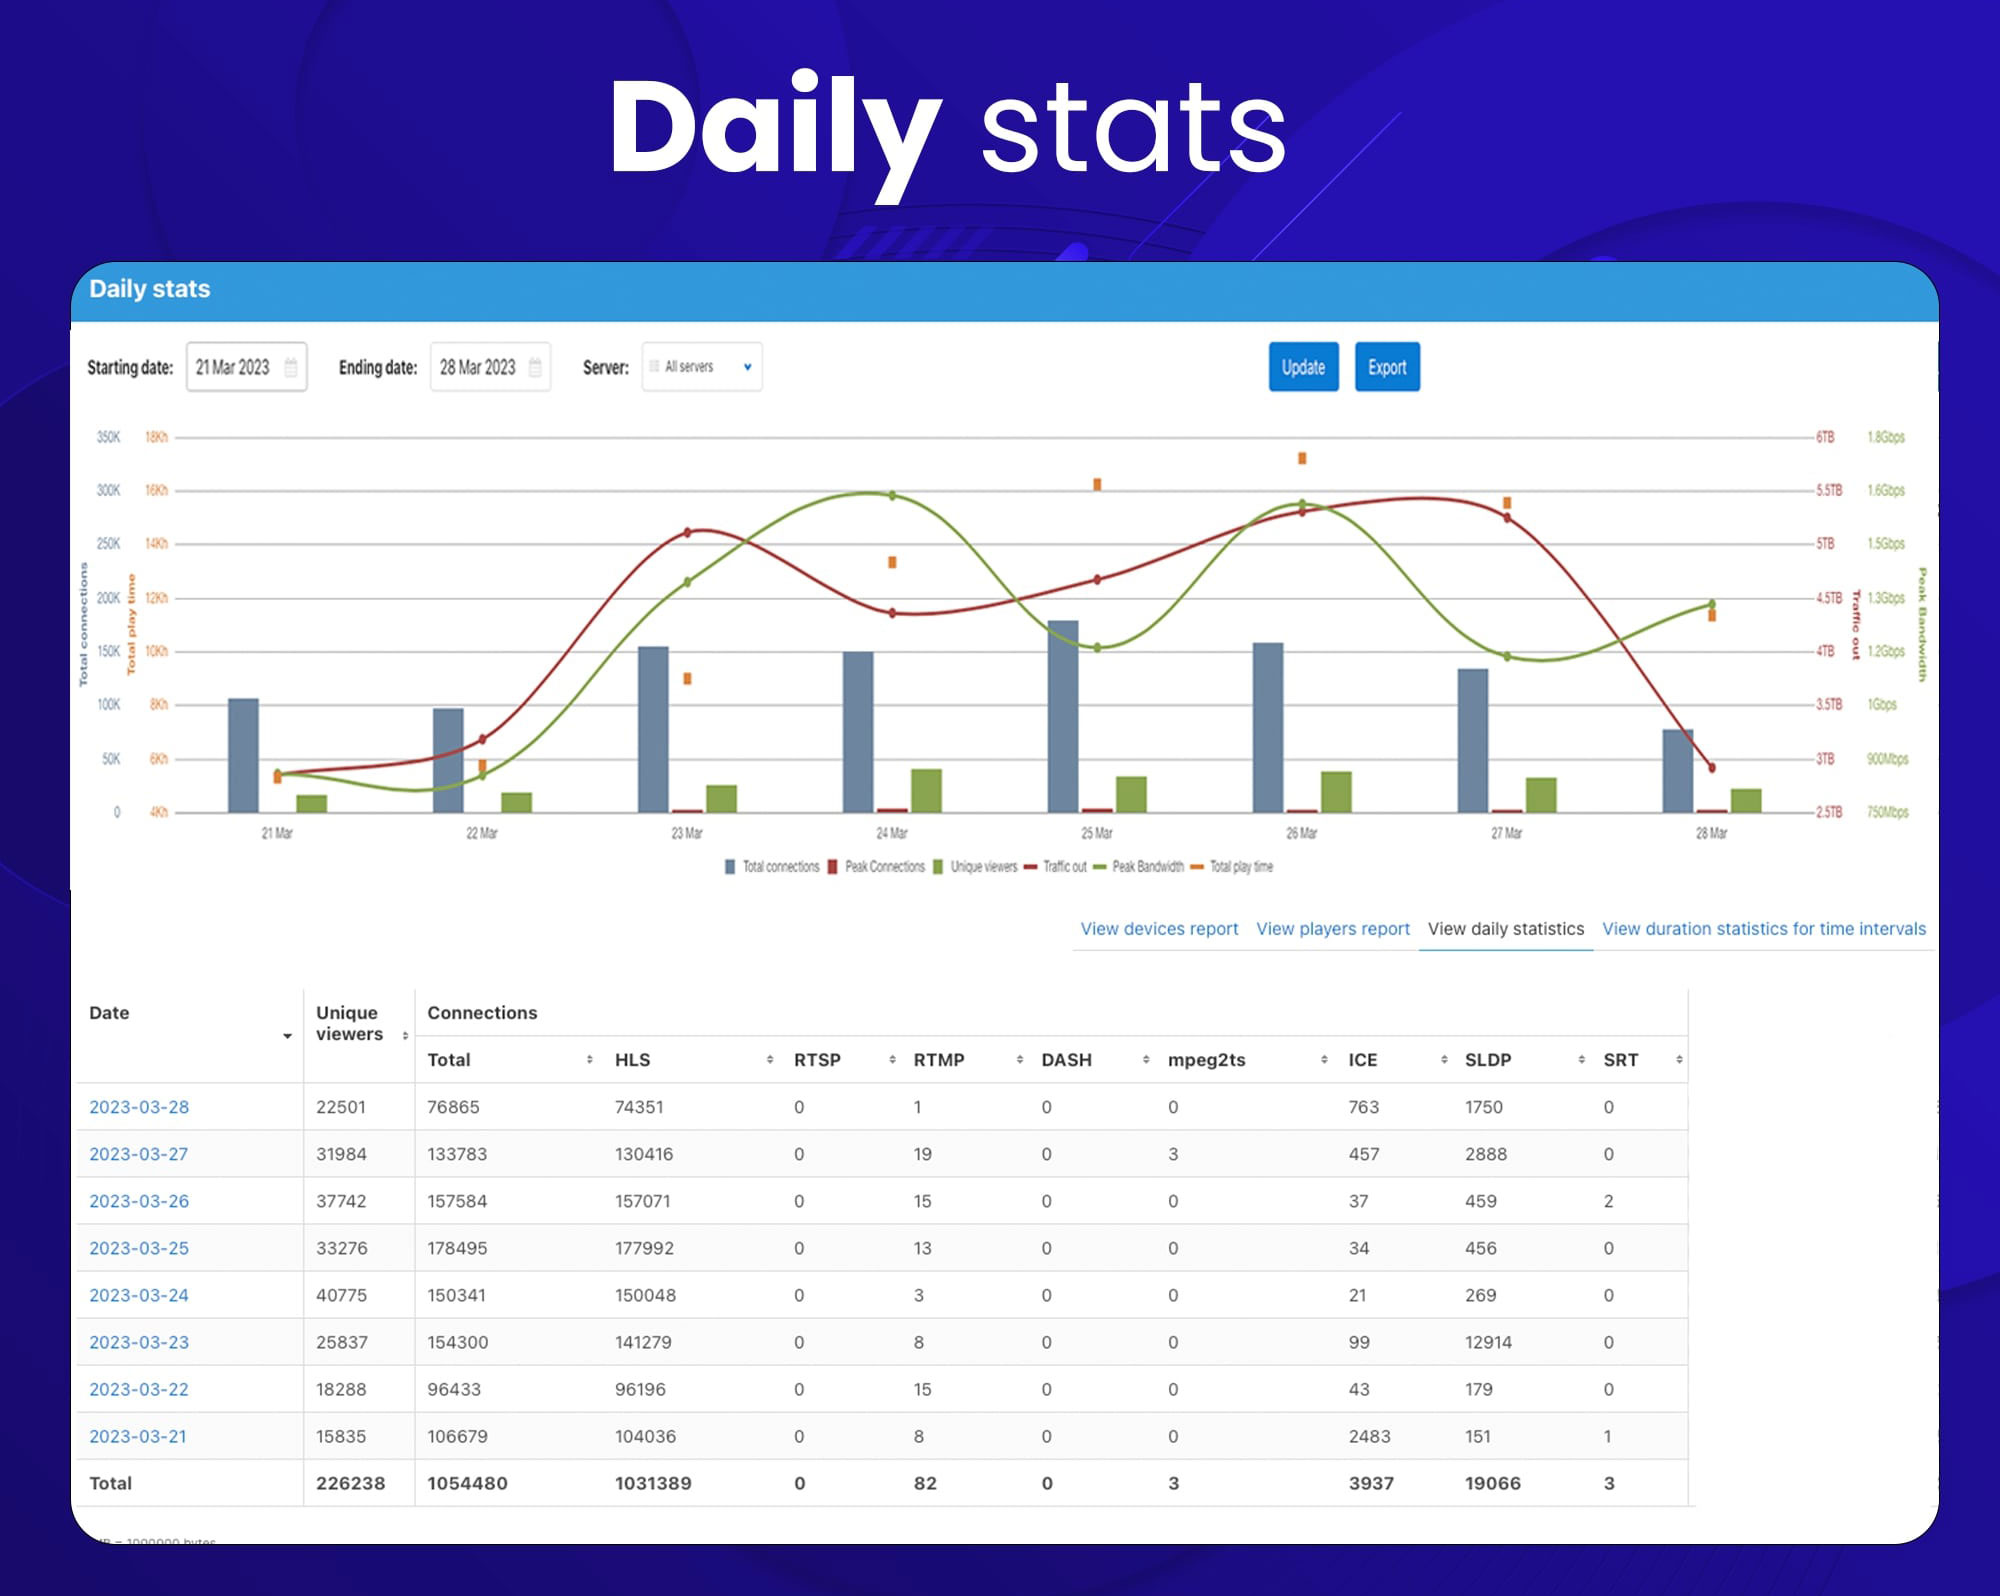
Daily stats
Daily stats are a type of statistics that provide information about the streaming activity of a particular channel or program over the course of a day.
These stats can be useful for understanding when viewers are tuning in to a particular program, and how many viewers are watching at any given time. This information can be helpful for businesses and organizations looking to optimize their streaming strategy, as it can help them understand which times are the most popular for their content, and how to schedule live events or promotions to maximize engagement.
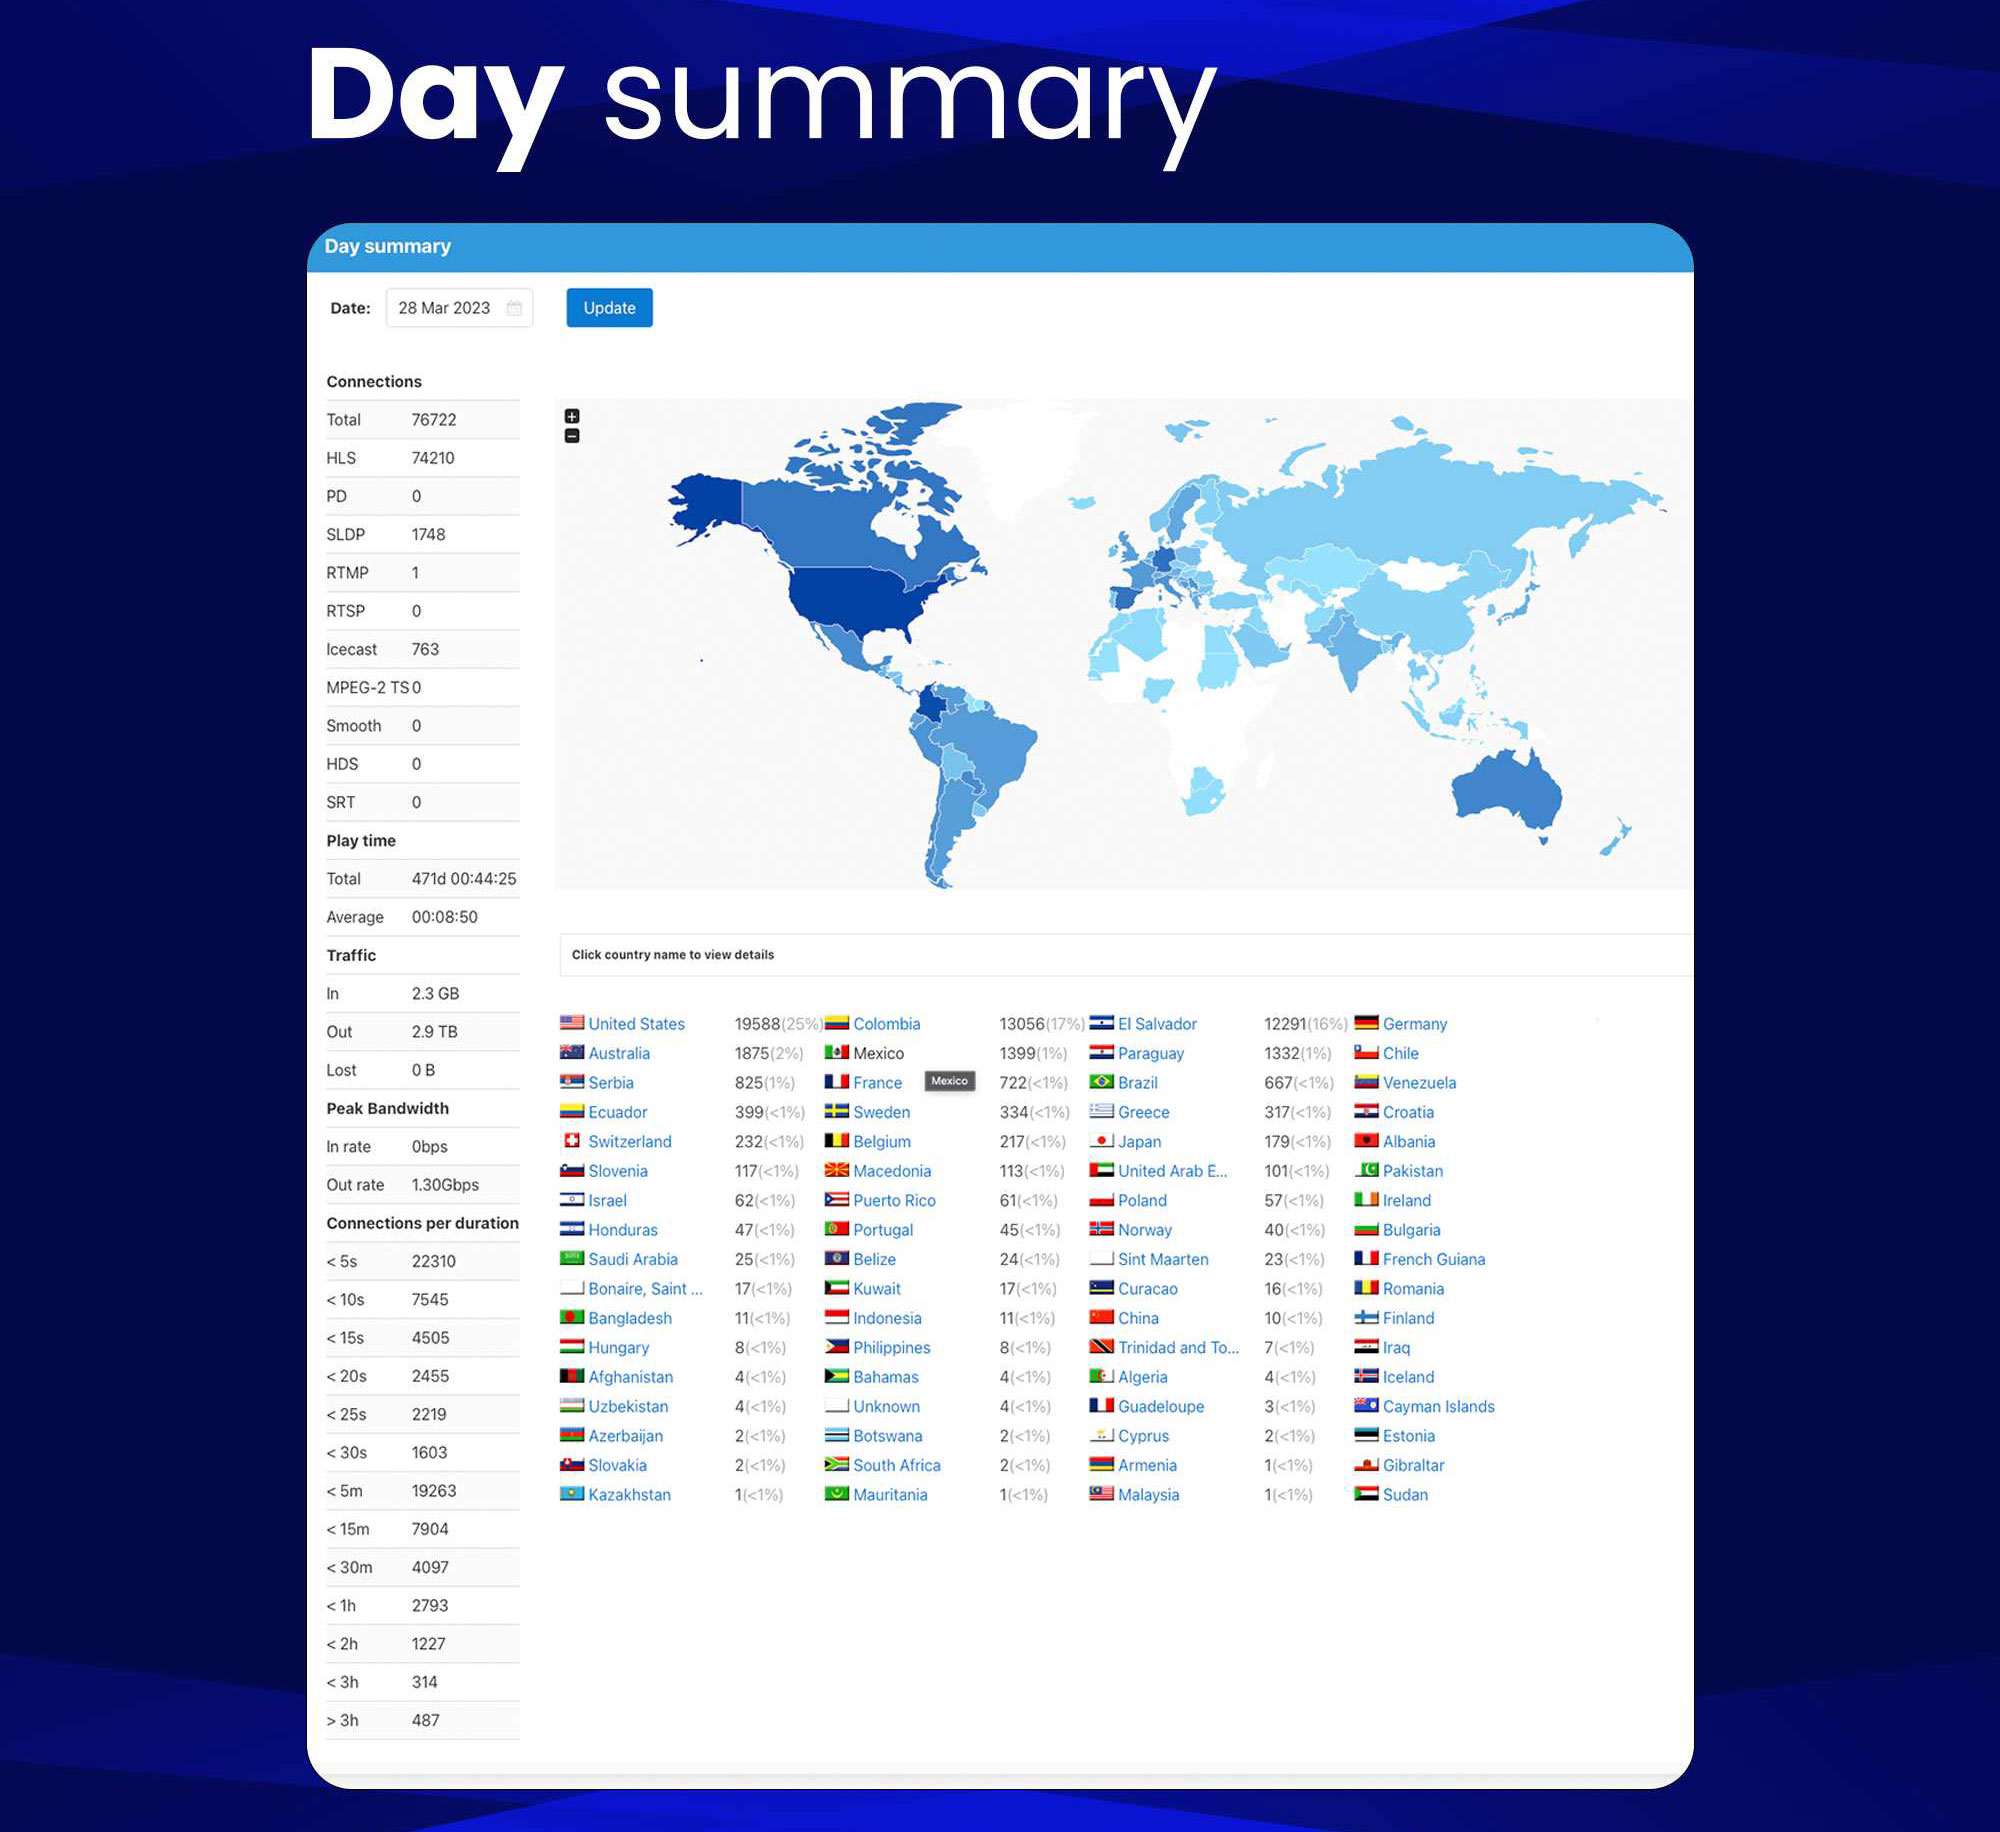
Day Summary
A day summary is a type of statistic that provides a summary of streaming activity for a particular day. This can include metrics such as the number of viewers, the total viewing time, and the peak viewing times throughout the day. Viewer location.
Day summaries can be useful for businesses and organizations looking to understand how their streaming content is being consumed on a day-to-day basis. This information can help them identify trends in viewer behavior, such as when viewers are most likely to tune in, and how long they are typically staying engaged with the content.
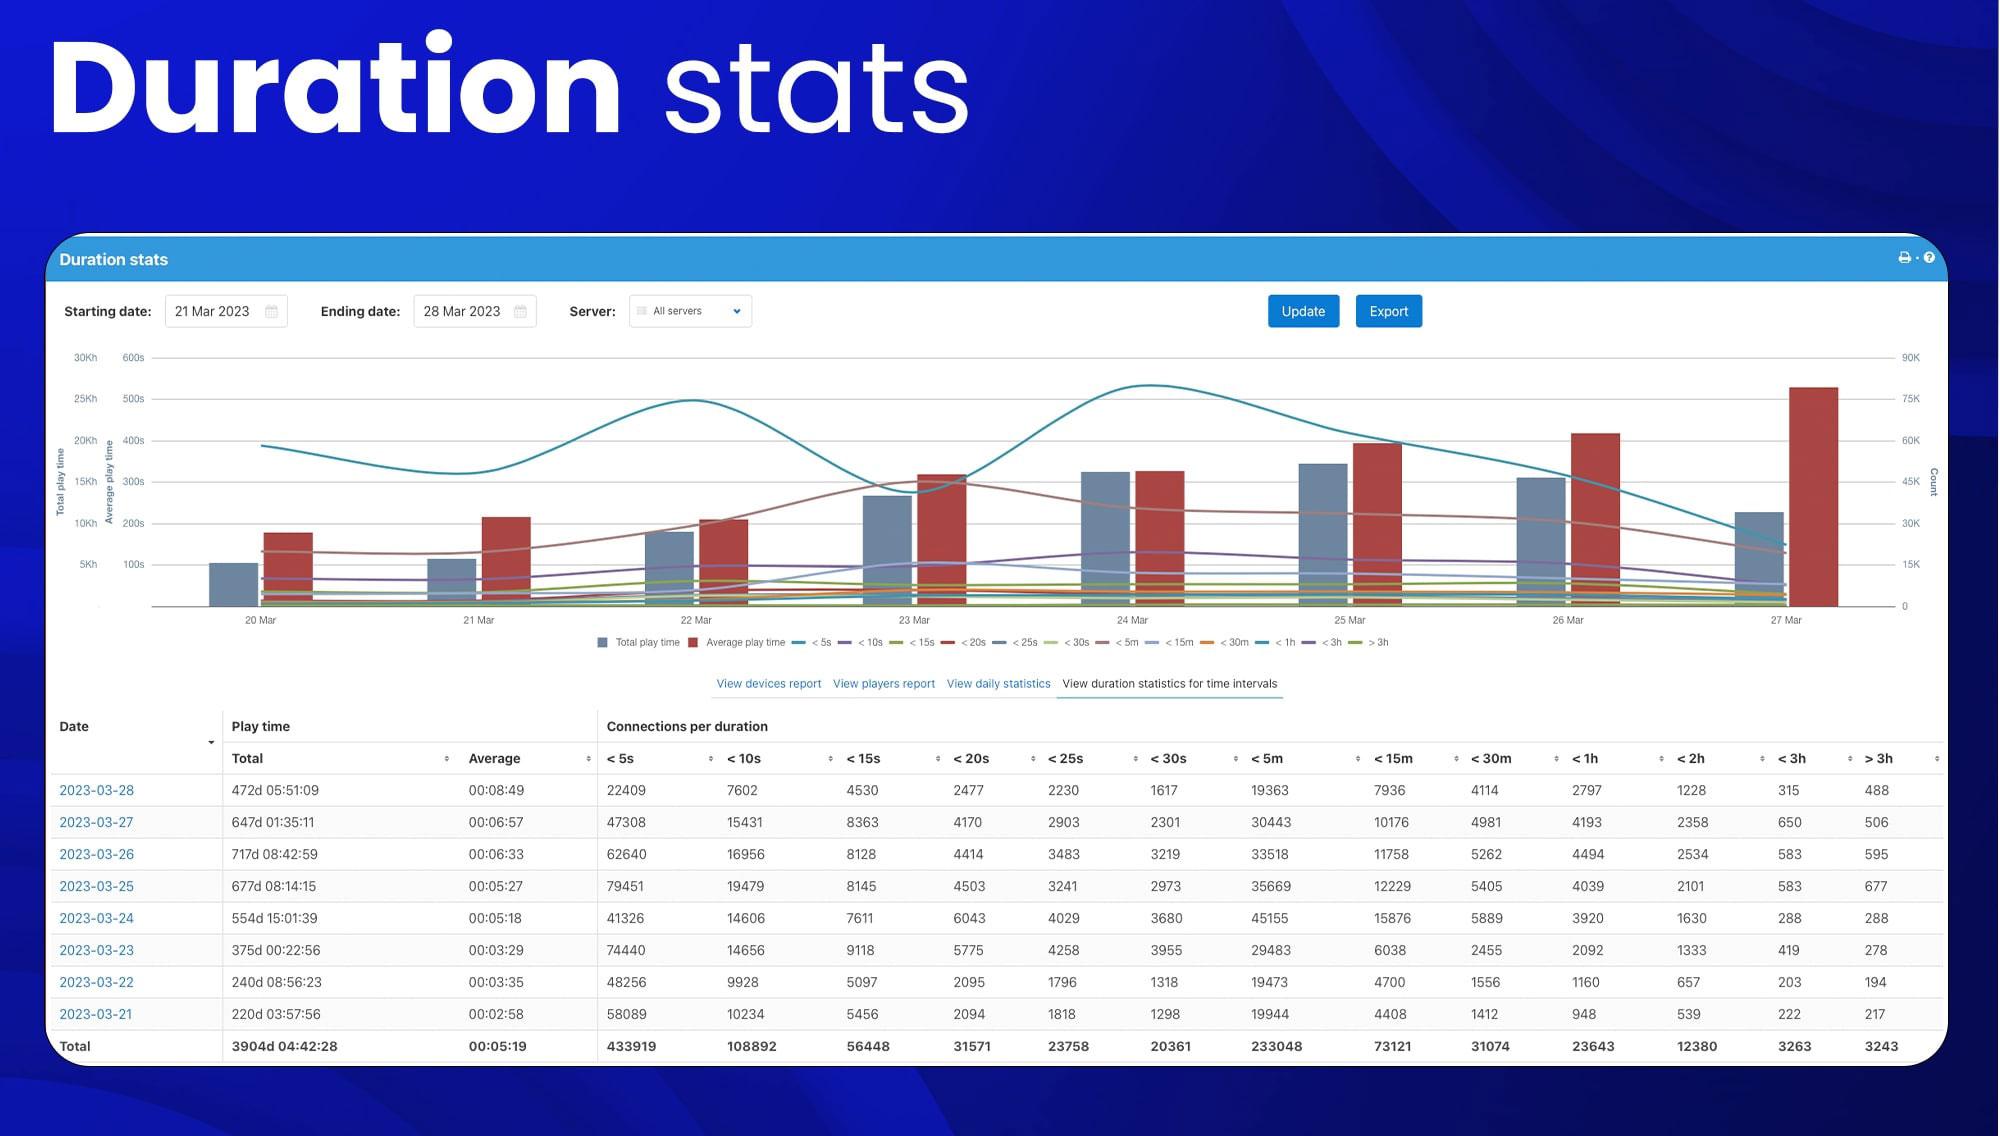
Duration stats
Duration stats are a type of statistics that can provide valuable insights into how long viewers are watching a particular stream or video.
This information can be useful for businesses and organizations looking to optimize their streaming strategy, as it can help them understand how engaging their content is and identify areas where they may need to make improvements. For example, if viewers are only watching a stream for a few minutes before tuning out, it may indicate that the content is not engaging enough or that the streaming experience is not user-friendly.
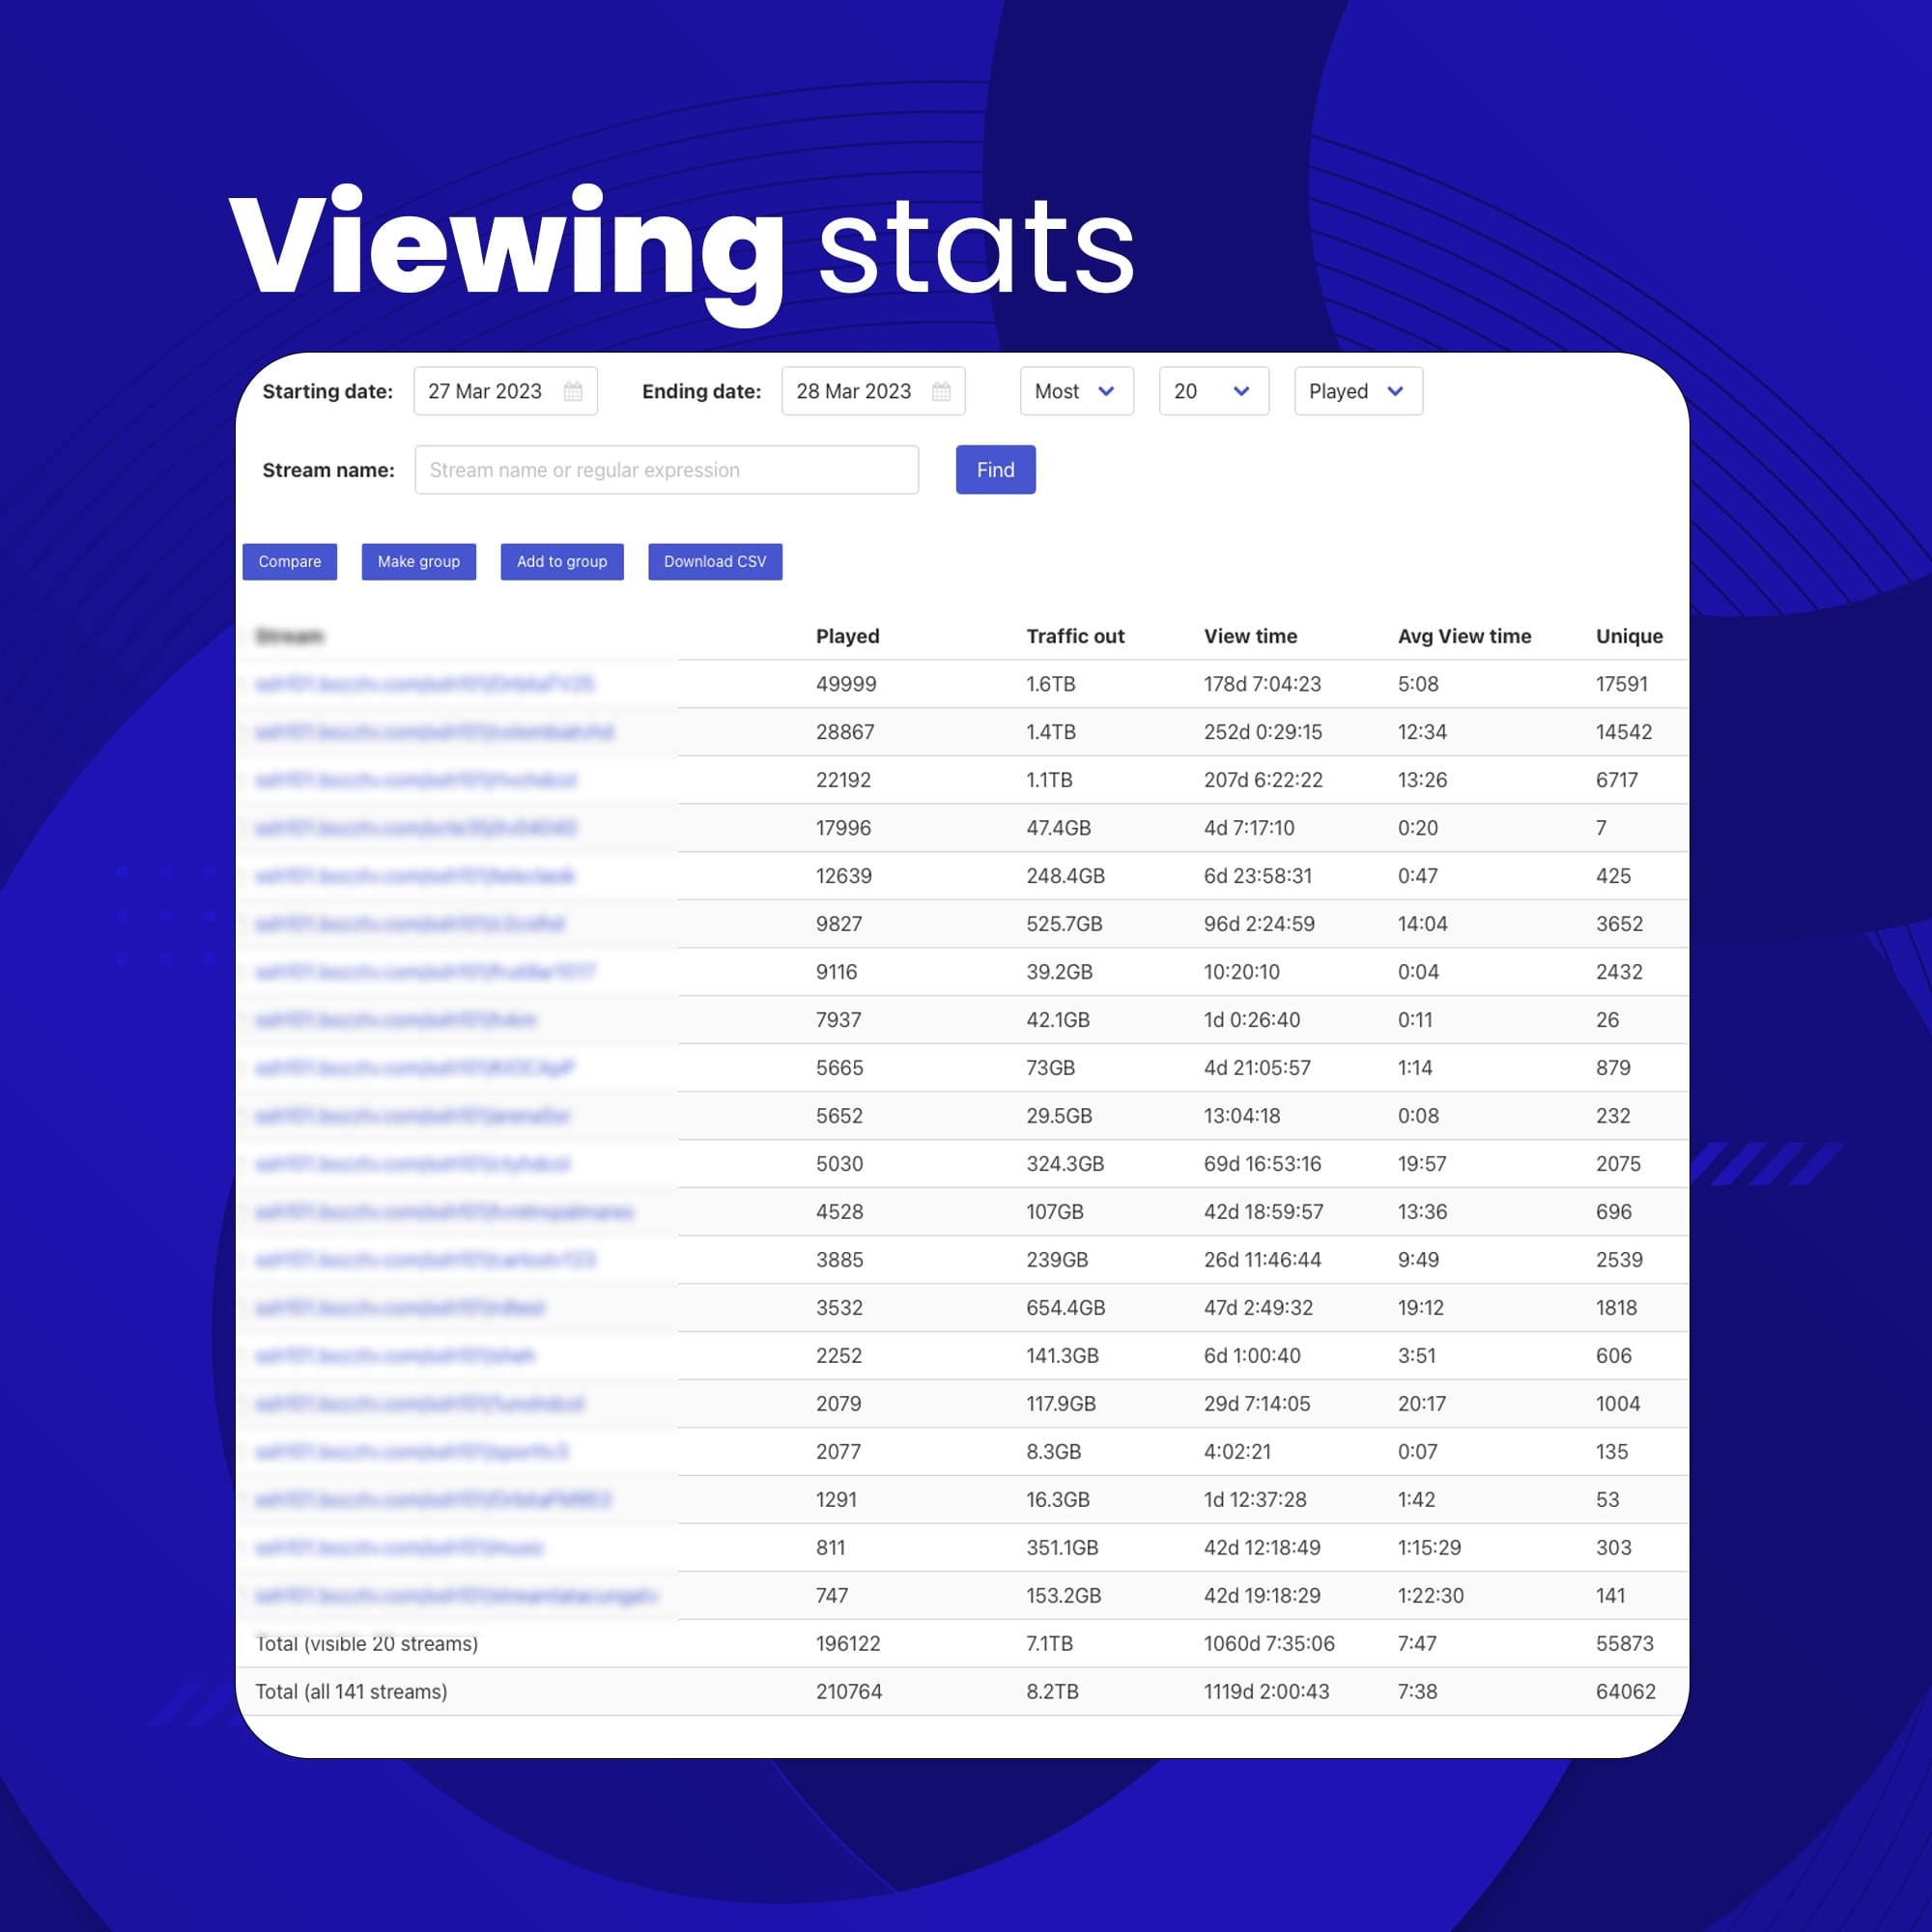
Viewing Stats
Viewing stats refer to the statistics that measure viewership data of a particular streaming service or video content. This can include metrics such as the number of viewers, viewing time, and viewer engagement.
Viewing stats are important for businesses and organizations as they help them to understand how their streaming content is being consumed by their audience. With this information, they can make informed decisions about their content, promotion, and marketing strategies
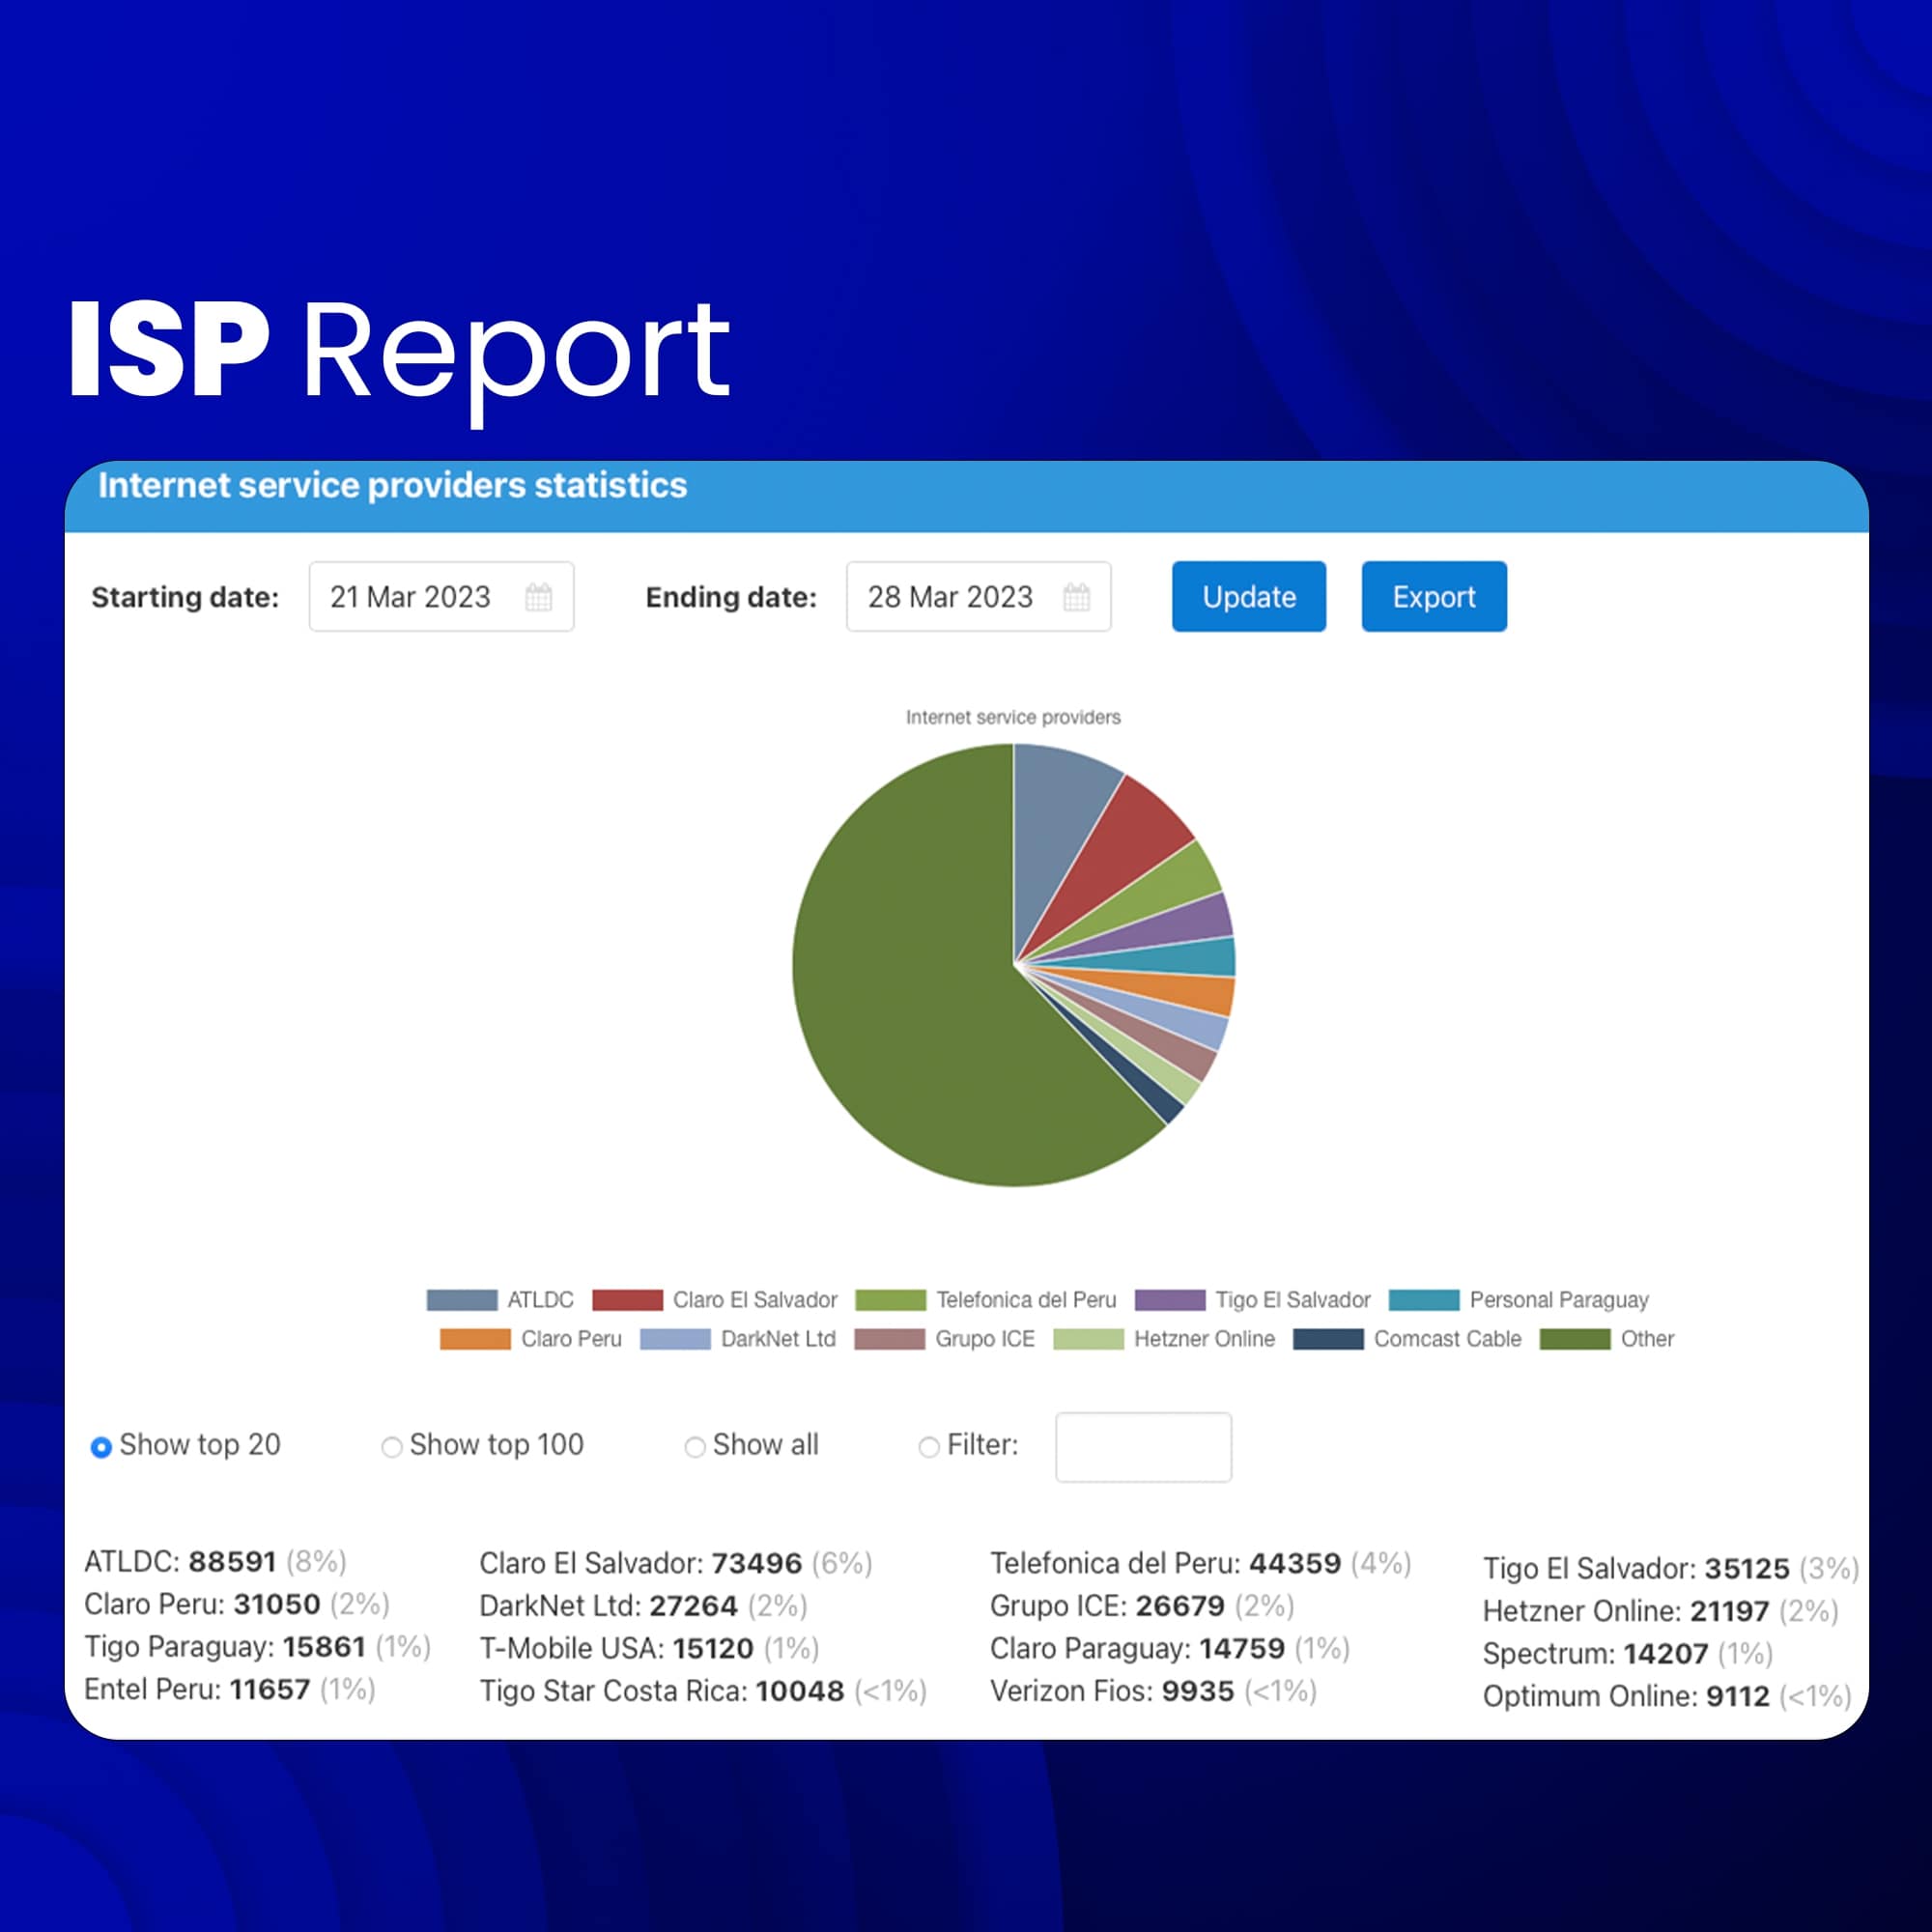
ISP Report
To find out which ISP (internet service providers) viewers are coming from. Tulix's CDN product provides ISP statistics and reporting on which ISPs streams were consumed. You can use these insights to optimize your content delivery strategy, improve the customer experience, and target your marketing efforts more effectively.
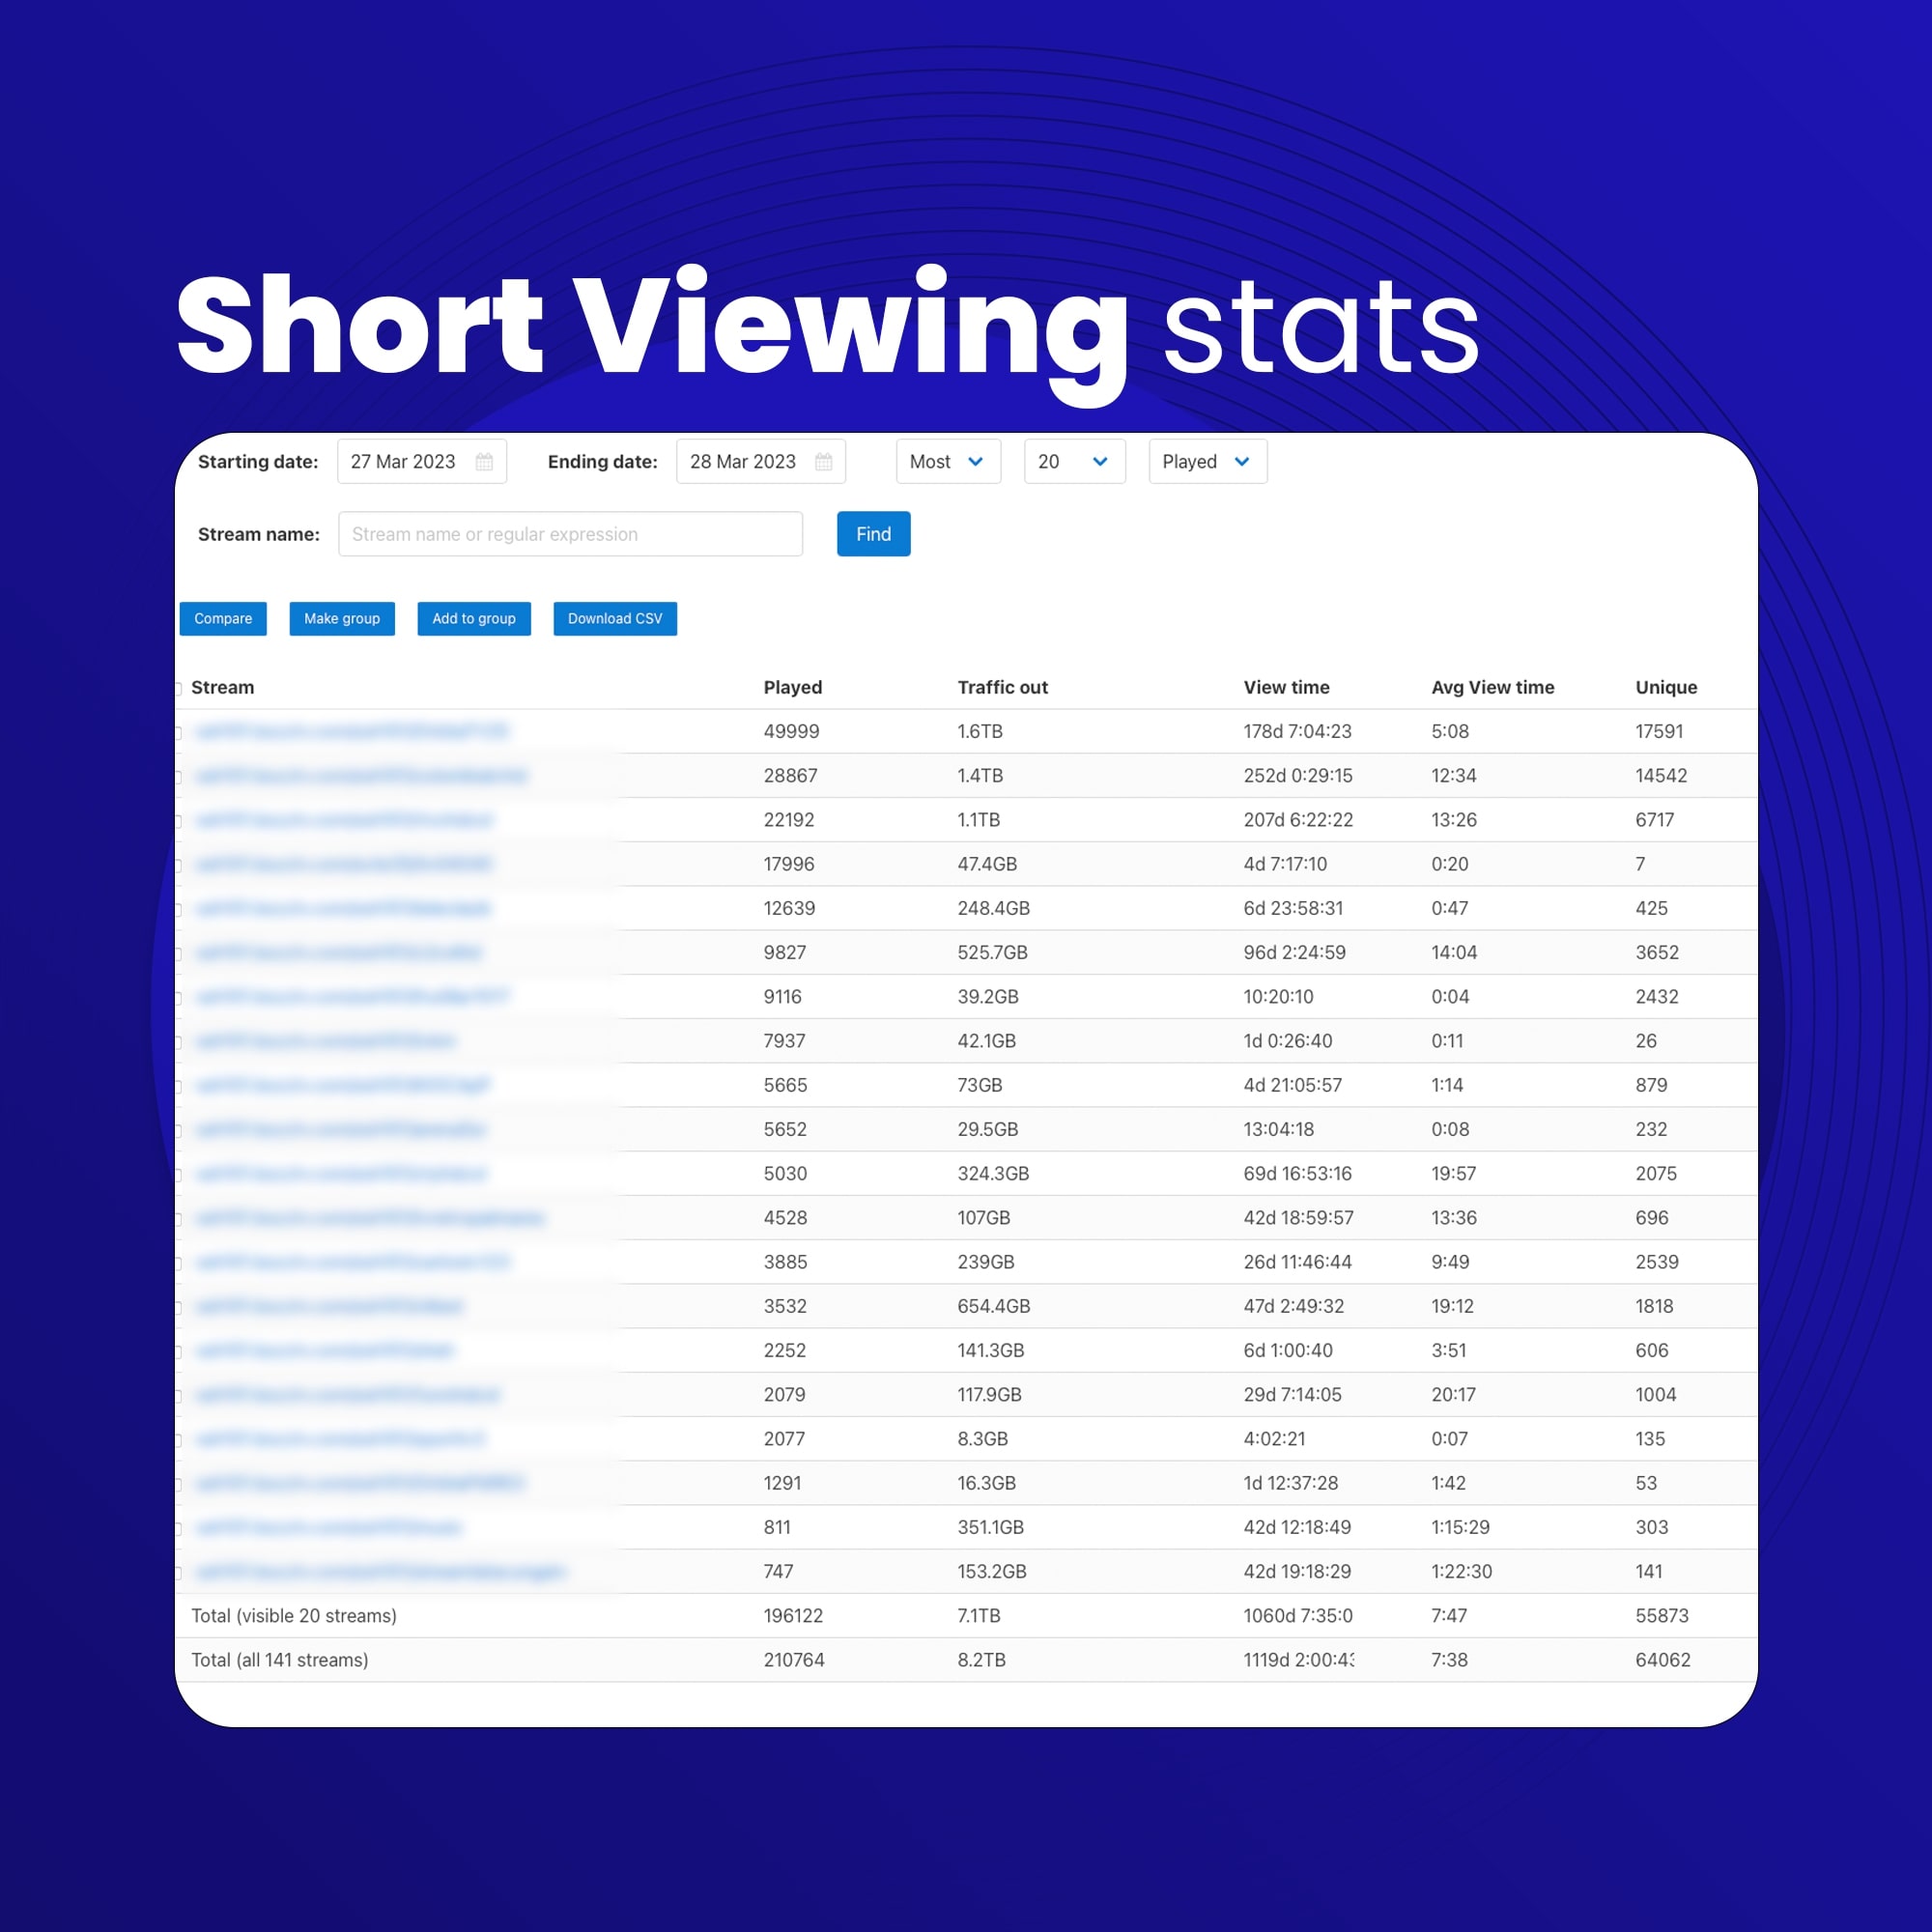
Short viewing stats
Viewing Stats refer to data that is collected and analyzed to gain insights into how viewers are consuming and engaging with video content. Short viewing stats can include information such as the number of views, watch time, average view duration, and audience retention rates.
These stats can be useful in a number of ways, such as helping content creators understand which videos are resonating with their audience, identifying areas for improvement, and making data-driven decisions about content strategy and marketing efforts.
Some of the key metrics to look for when analyzing viewing stats include:
- Total views (played 0n image) : The number of times a video has been viewed.
- Watch time (view time on image): The total amount of time that viewers have spent watching a video.
- Average view duration (Average View time on image) : The average length of time that viewers watch a video.
- Unique Viewers - Unique viewers refer to the number of individual viewers who have watched a particular stream or content. For example, if a stream has been viewed by 1000 people, but only 850 of them are unique viewers, the unique viewer count for that stream would be 850. Unique viewer stats can be helpful in determining the popularity and reach of a particular content or stream.
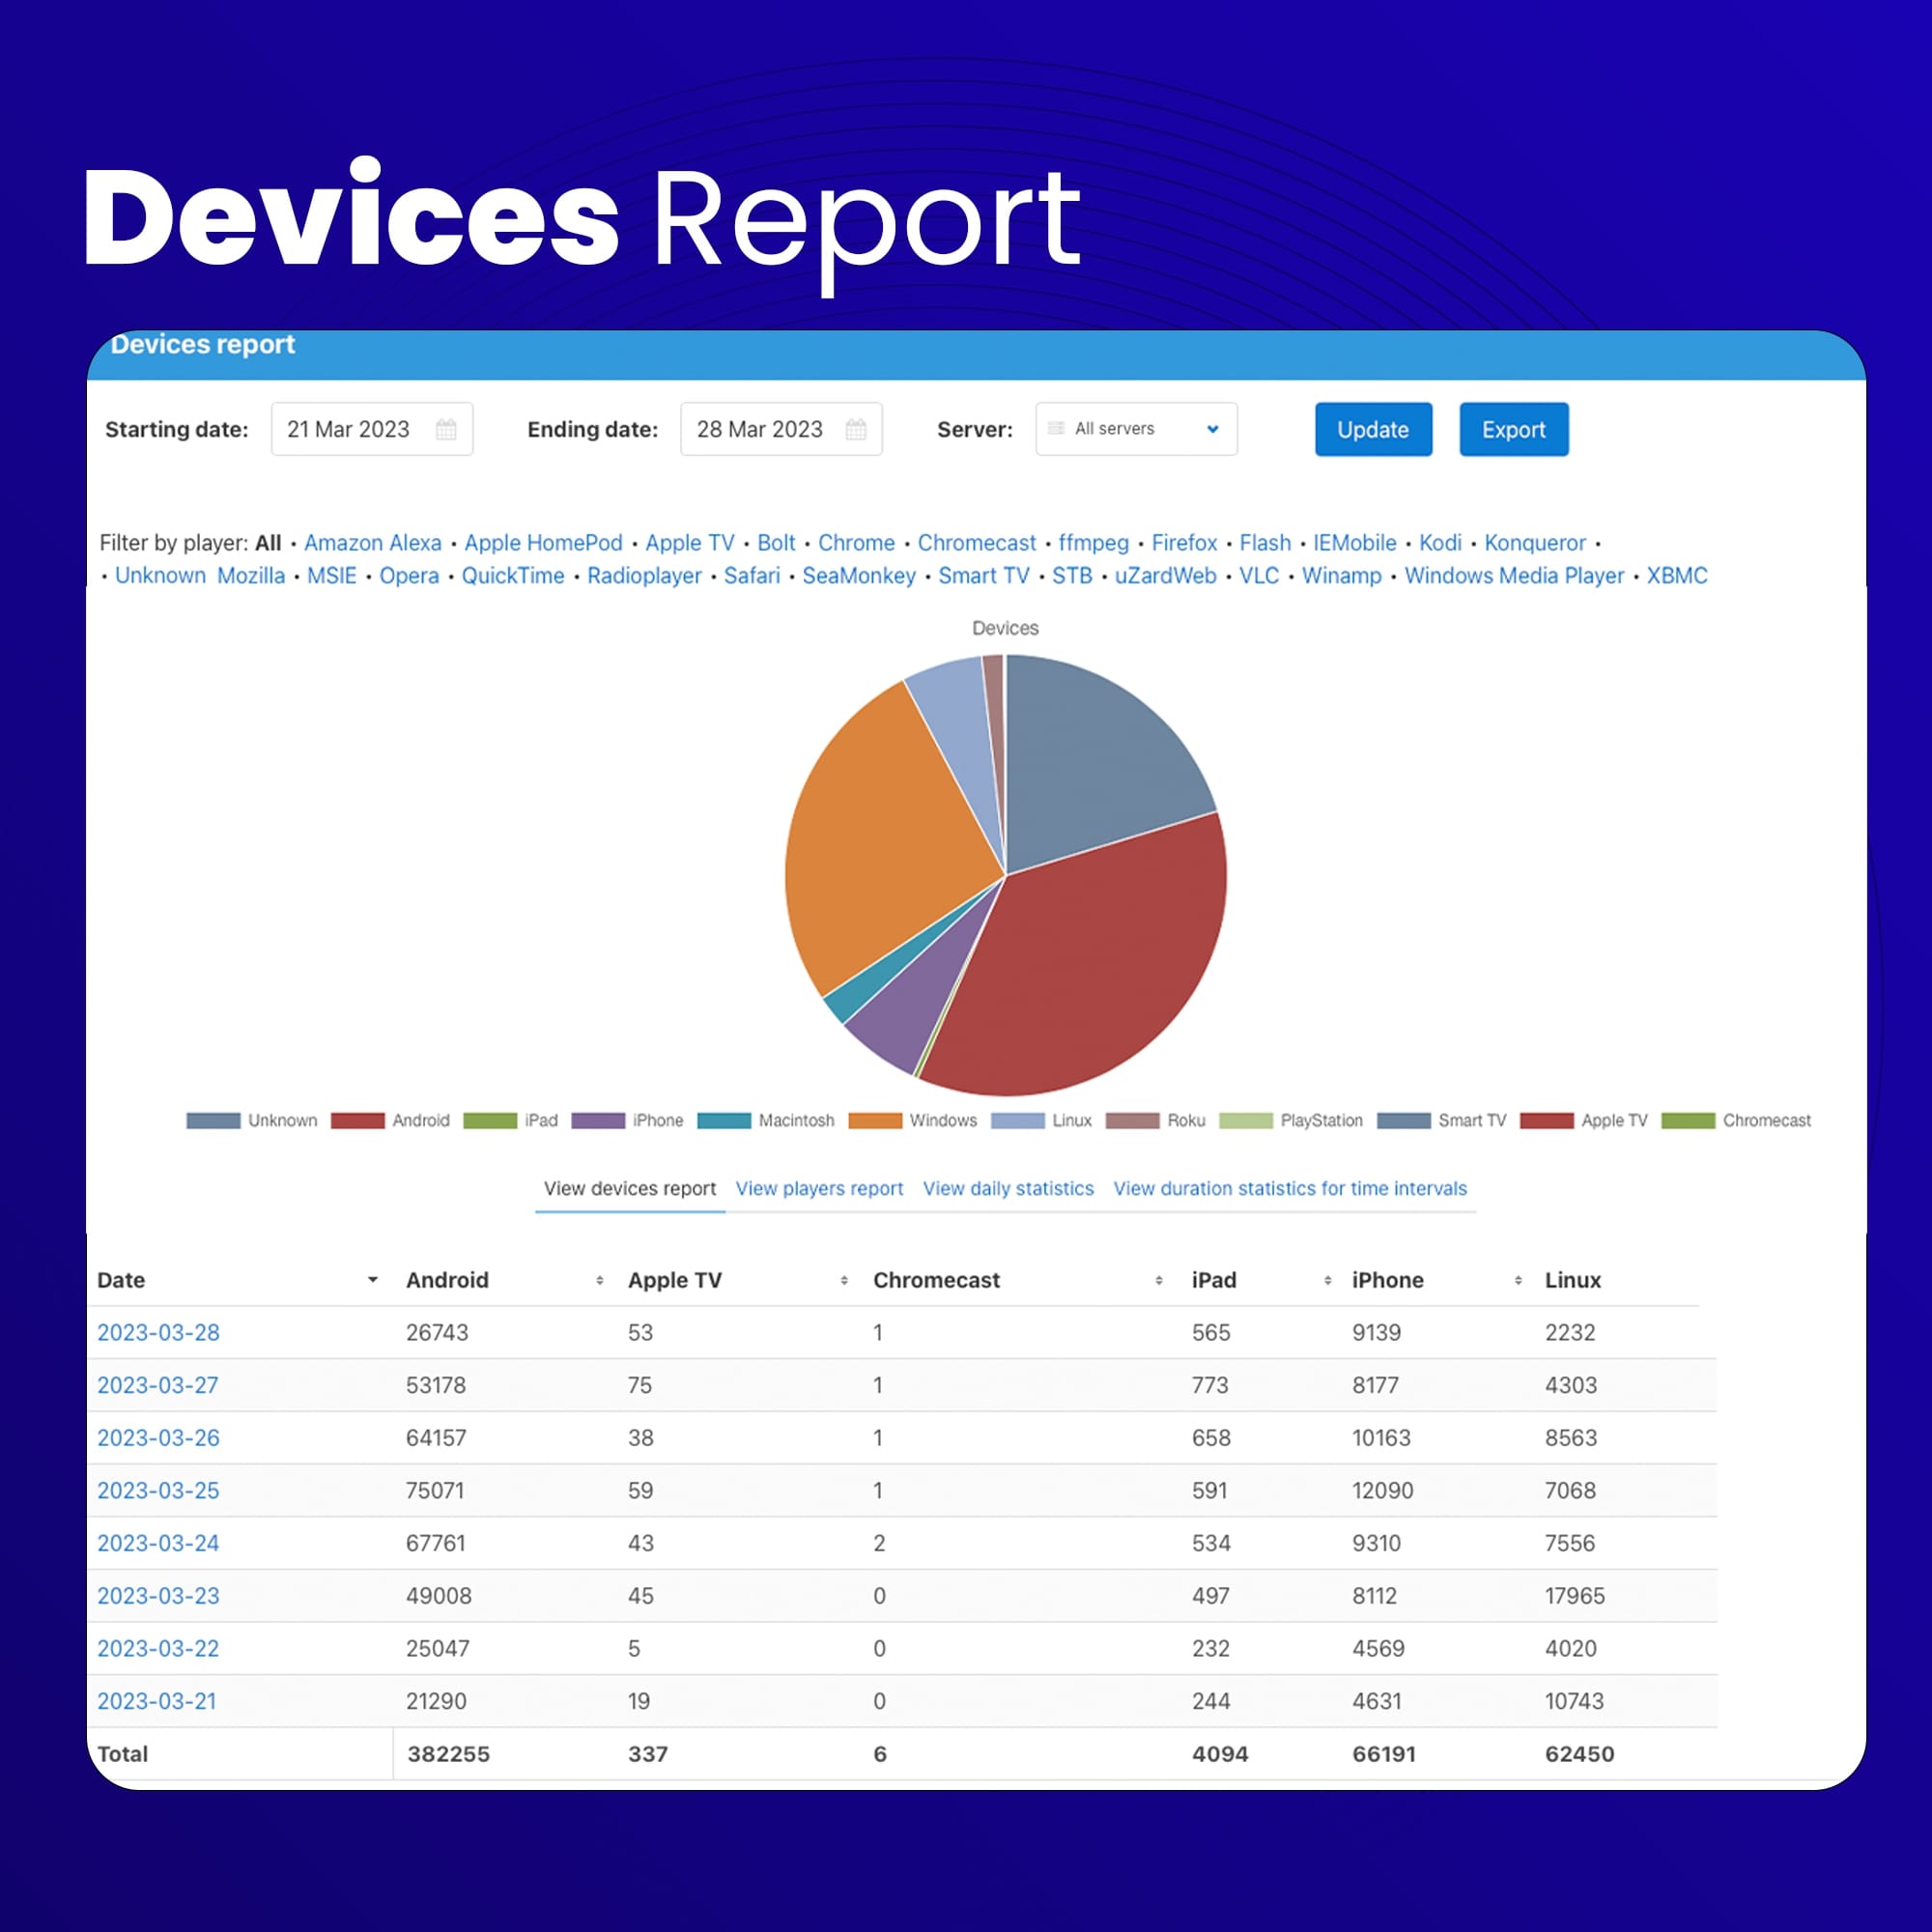
Device reports
Device reports are a type of analytics report that provides information on the types of devices that are being used to access content or services. These reports typically include data on the types of devices, operating systems, screen sizes, and other relevant information. Device reports identify potential issues with compatibility or user experience. If a large number of users are experiencing issues on a particular device or platform, the provider can investigate and take steps to address the issue.
Device Reports are valuable information for providers to better understand their audience and improve their offerings to provide the best possible user experience.
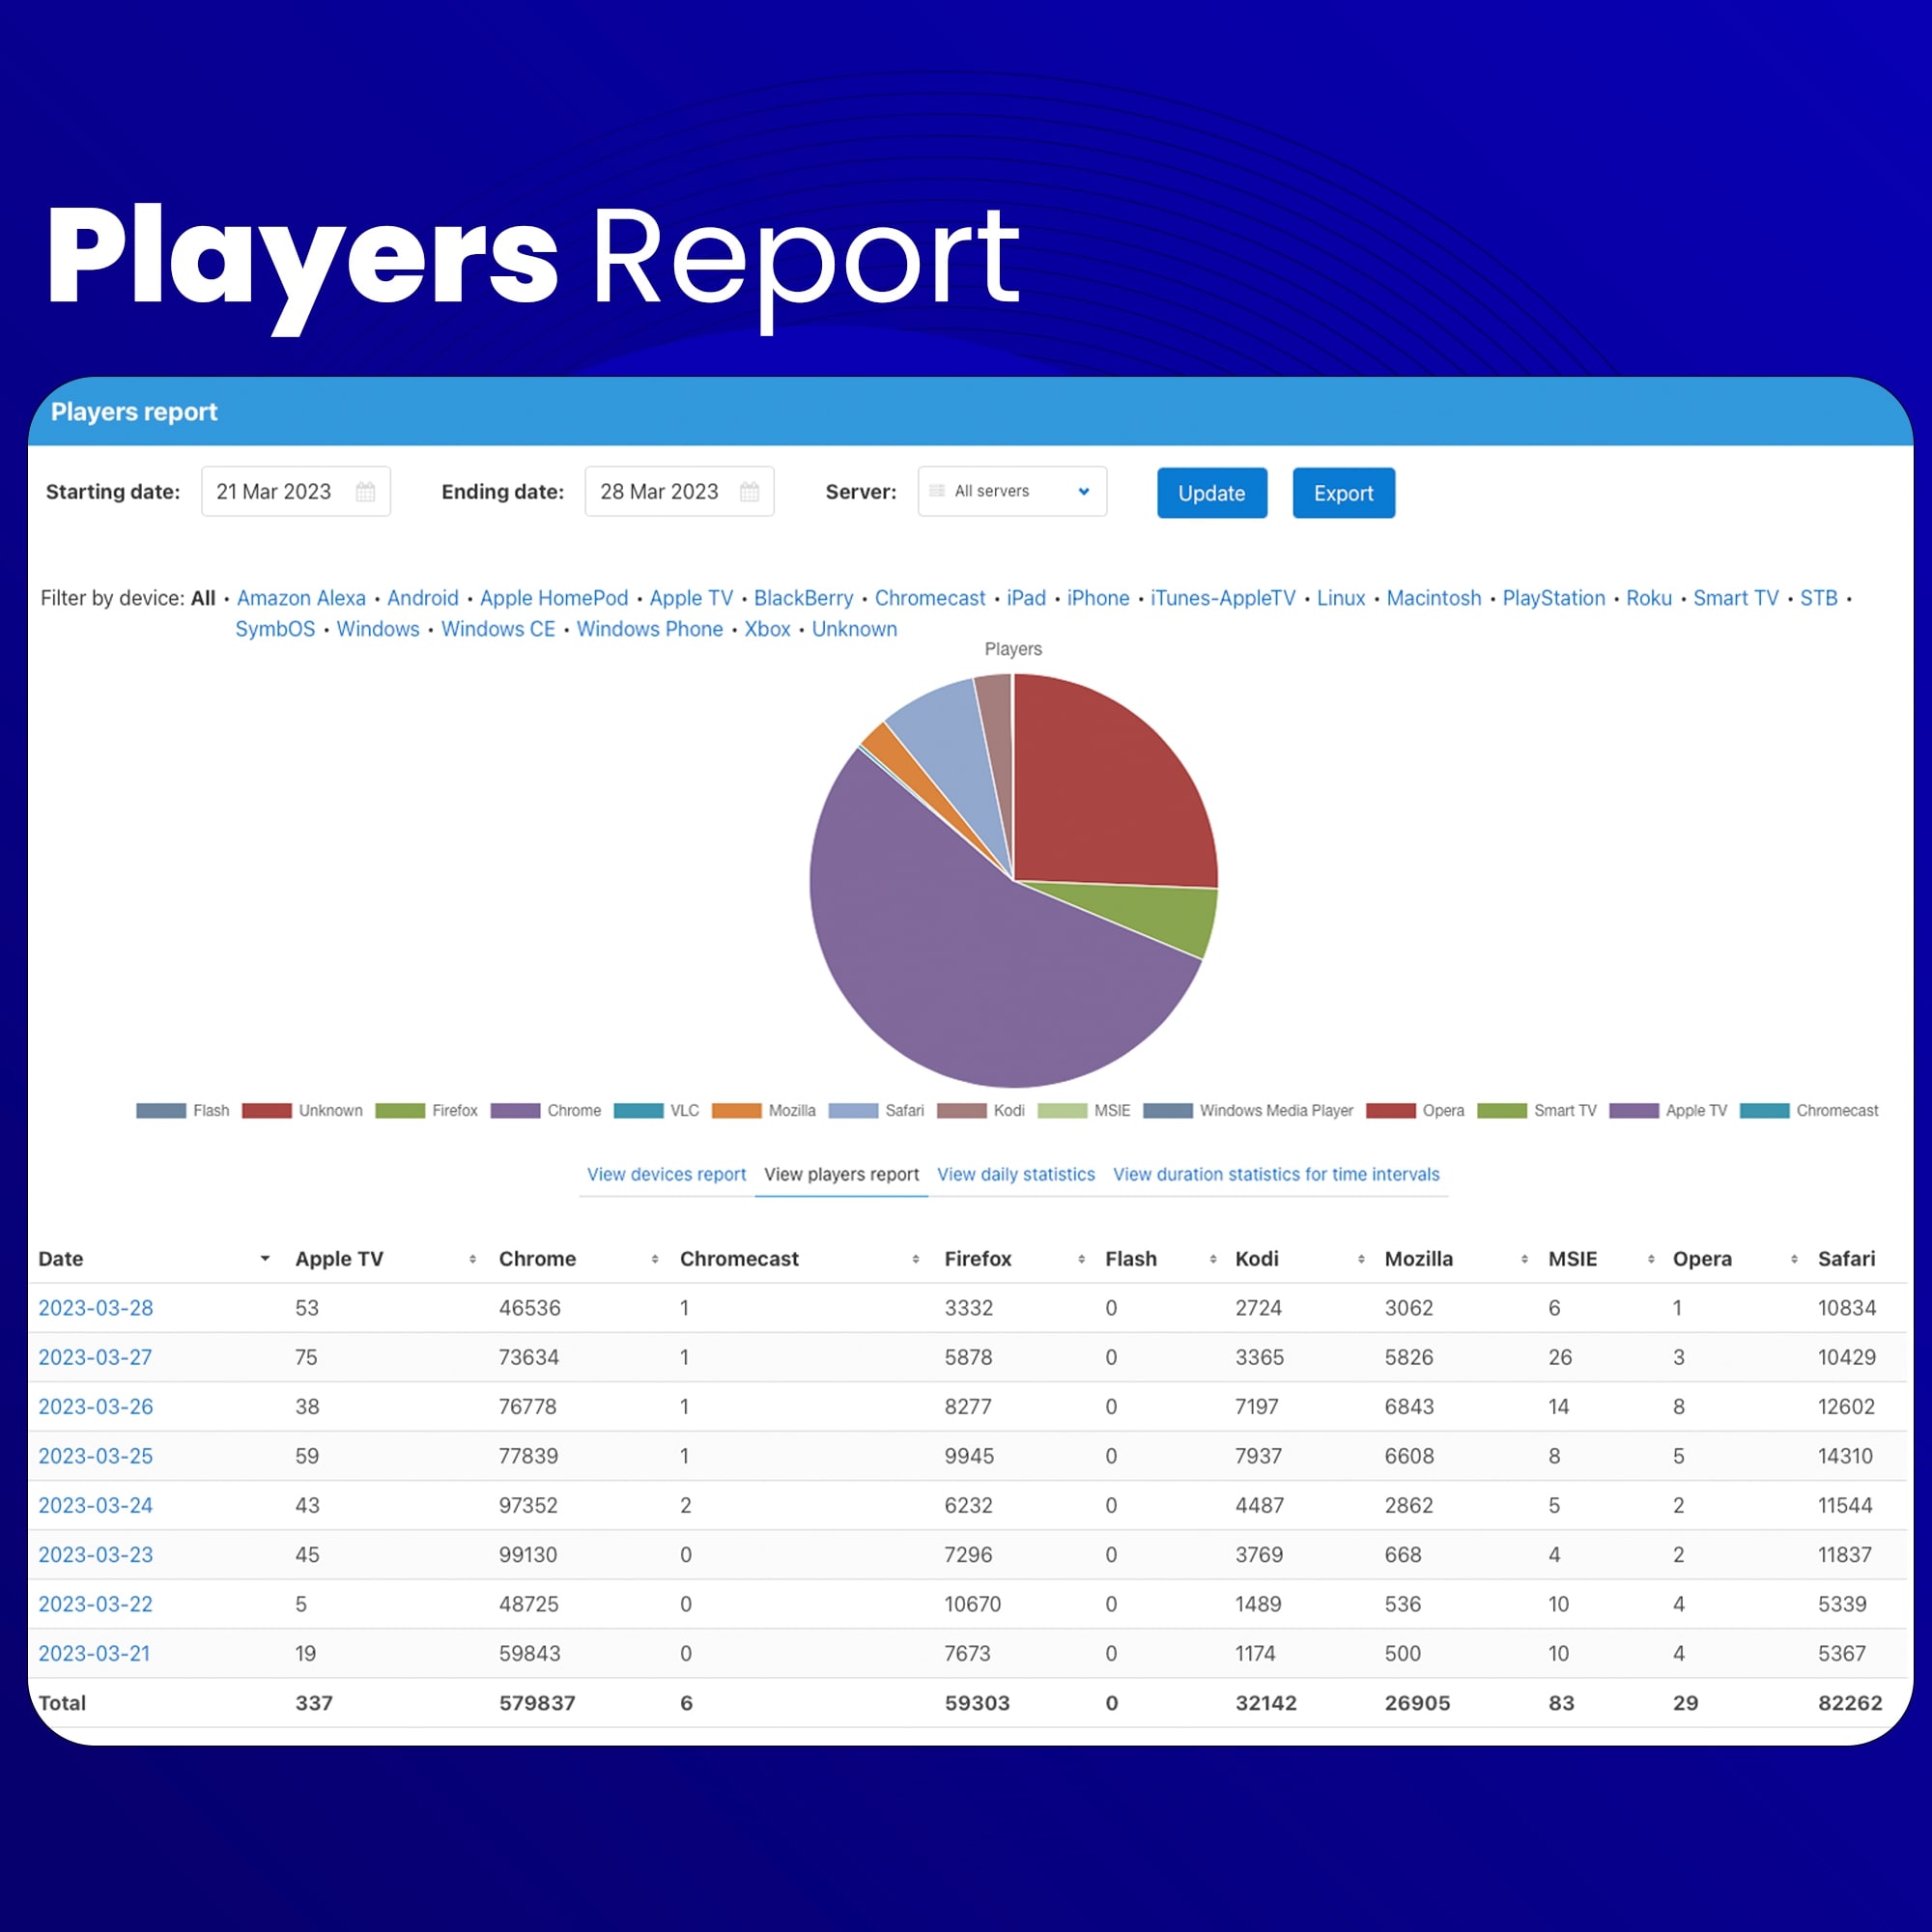
Player Reports - Similar to Device reports
Player reports can be used by content providers and service providers to identify issues with player performance and improve the user experience and also can be used to analyze user behavior and engagement.
Overall, player reports are a valuable tool for providers to better understand player performance and user engagement, and to optimize their offerings to provide the best possible user experience
Tulix provides all the important data you could need/want to understand your audience. For more information about these statistics and why they matter, give us a call at +1 404 584 5035.